Run-Length Distribution Analysis with HeuristicLab
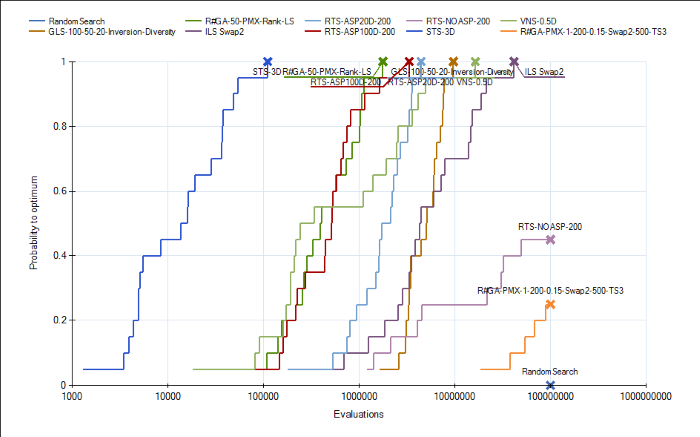
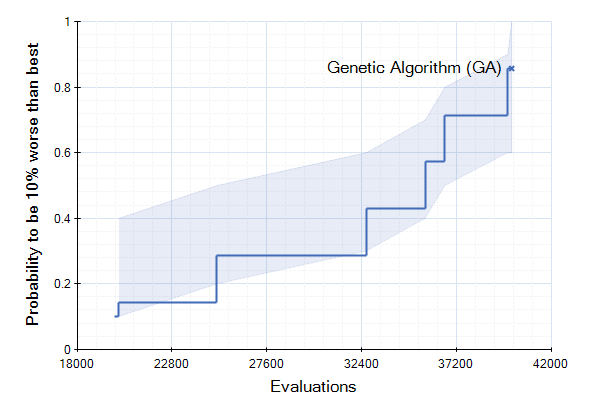
We have included in our trunk today new analyzers for measuring algorithm performance. The analyzers are called QualityPerEvaluationsAnalyzer and QualityPerClockAnalyzer. They record the convergence graph in each run and add it as a result. A new run analyzer called "Run-length Distribution View" can be used to build, so called, ECDFs out of the convergence graphs in the individual runs using a single or multiple targets. This allows plotting the cumulative success probability of reaching a certain fitness value given a certain effort (measured in evaluated solutions or elapsed wall-clock time). These plots can be used to compare the run-length distributions of algorithm instances applied to one or many problem instances.
The run-length distribution view can cope with runs of different length such that it would not simple plot the number of hits divided by the total number of runs in the experiment. Instead, the denominator is decreased whenever a run missed the target and terminated prematurly. Thus one can use shorter runs to obtain more accurate ECDFs for lower amounts of function evaluations. In order to visualize missed runs, we plot a shaded area for every curve that represents the min and max bounds for the ECDF. The minimum level is pessimistic and assumes that all prematurely missed runs would have not hit the target later on. The upper level is optimistic and assumes that all prematurely missed runs would have immediately found the target right afterwards. The line that is based purely on the observed hits is thus in-between these two.
Together with the other run analyzers this one provides another means for algorithm developers to test and compare their instances. Currently, this feature is part of the main development trunk.
In memoriam John H. Holland 1929-2015
We're sorry to hear that the inventor of the genetic algorithm, John H. Holland, has passed away at 86. He was a pioneer in the study of complex adaptive systems and an inspirational source for many researchers including our research group. The importance of his work cannot be emphasized enough and it will certainly continue to influence generations of researchers that are yet to come.
CMA-ES Implementation in HeuristicLab
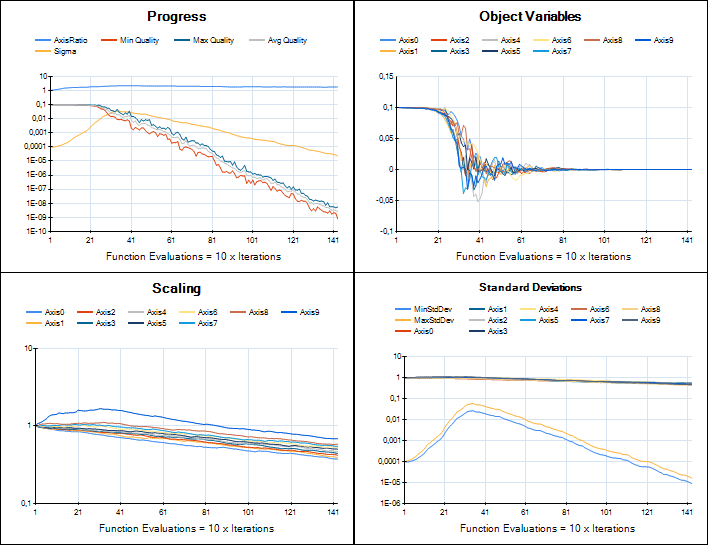
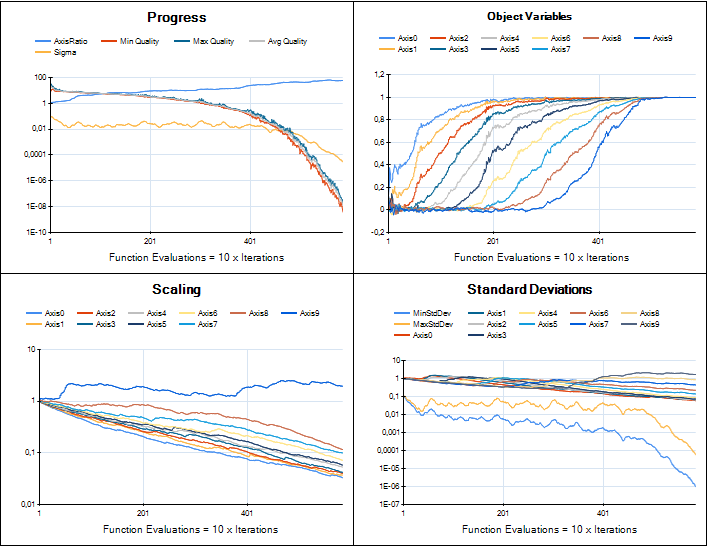
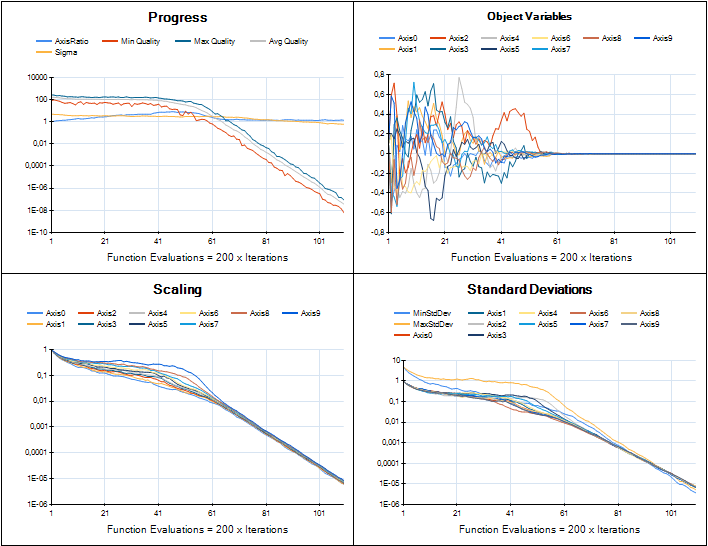
We are working on providing an implementation of CMA-ES in HeuristicLab for real-valued optimization. The developments are tracked in ticket #1961 and the implementation is based on Hansen's Java implementation. Porting that code to C# is now almost complete and the integration into HeuristicLab looks very nice. Although most of the original code parts could be preserved the integration required to break some parts apart and reassemble them in a different way. I was very pleased to see Hansen providing "trusted output" image samples for implementers to check if their version performed similar. Here is a comparison of HeuristicLab's implementation (left) with the trusted output images (right).
Sphere
Rosenbrock
Rastrigin
The plugin is still not part of the trunk, but available in a branch which can be compiled by anyone. I attach a current binary version of the plugin to this post if you want to try it (add it to the latest daily build, unblock the dll after you download it). CMA-ES currently can be used to solve any problem that is based on the Encodings.RealVector plugin and uses an IRealVectorCreator as solution creator. Of course the implementation may still change and may break files.
Parameter Variation Experiments in Upcoming HeuristicLab Release
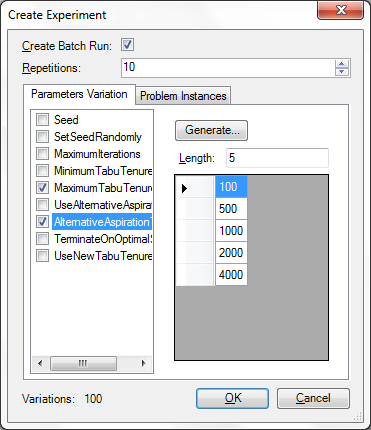
We've included a new feature in the upcoming release of HeuristicLab 3.3.7 that will make it more comfortable to create parameter variation experiments.
Metaheuristics and data analysis methods often have a number of parameters which highly influence their behavior and thus the quality that you obtain in applying them on a certain problem. The best parameters are usually not known a priori and you can either use metaoptimization (available from the download page under "Additional packages") or create a set of experiments where each parameter is varied accordingly. In the upcoming release we've made this variation task a lot easier.
We have enhanced the "Create Experiments" dialog that is available through the Edit menu. To try out the new feature you can obtain the latest daily build from the Download page and load one of the samples. The dialog allows you to specify the values of several parameters and allows you to create an experiment where all configurations are enumerated.
We have also included the new problem instance infrastructure in this dialog which further allows you to test certain configurations on a number of benchmark instances from several benchmark libraries.
Finally, here are a couple of points that you should be aware of to make effective use of this feature. You can view this as a kind of checklist, before creating and executing experiments:
- Before creating an experiment make sure you prepare the algorithm accordingly, set all parameter that you do not want to vary to the value that you intend. If the algorithm contains any runs, clear them first.
- Review the selected analyzers carefully, maybe you want to exclude the quality chart and some other analyzers that would produce too much data for a large experiment. Or maybe you want to output the analyzers only every xth iteration.
- Make sure you check to include in the run only those problem and algorithm parameters that you need. Think twice before showing a parameter in the run that requires a lot of memory.
- Make sure SetSeedRandomly (if available) is set to true if you intend to repeat each configuration.
- When you make experiments with dependent parameters you have to resolve the dependencies and create separate experiments. For example, when you have one parameter that specifies a lower bound and another that specifies an upper bound you should create separate experiments for each lower bound so that you don't obtain configurations where the upper bound is lower than the lower bound.
- Finally, while you vary the parameters keep an eye on the number of variations. HeuristicLab doesn't prevent you from creating very large experiments, but if there are many variations you might want to create separate experiments.
New Feature: Embedded Benchmark Problem Instances
I wanted to share a feature that we have included into our trunk yesterday and which will be part of the next release. It was our intention to aid people in benchmarking their algorithms. Usually in the literature a number of benchmark problem instances are known and shared. These instances allow to directly compare the performance of two algorithms. We have now included some of these benchmark libraries as plugins and make them directly available with HeuristicLab. Currently we have included TSPLIB, QAPLIB, and several others. Each library is a separate plugin that stores the files inside the assembly. It is very easy to add new benchmark libraries, as well as to adapt the problems to use them. A problem can make use of multiple, even different libraries.
We plan to expand this to include even more libraries so that you don't have to search the web for the files, but just load them in HeuristicLab. You can try the feature for yourself if you grab the latest daily build.
Large Experiment Design for Programmers
Recently, I've been executing a couple of very large parameter experiments with over a thousand batch runs resulting in more than 27,000 individual runs. I want to share with you how I did that and some things that have to take care of. Unfortunately we don't yet have a graphical designer for this task and so it requires a little bit of programming. However I have prepared a small solution which you can find attached to this post that you can build upon. It's not the experiment that I created, I cannot share that with you, but one that builds on the Genetic Algorithm and the Traveling Salesman Problem. Comments are always welcomed here or in our google group!
The goal of this experiment was to test several parameter configurations on a number of problem instances in order to find the configuration that performed best in those instances. Such an experiment can be created in the Experiment View by hand as well. However all the batch runs and configurations need to be created manually which takes some time.
To start with such a large experiment it is important to prepare a template file in the HeuristicLab optimizer. This template constitutes the algorithm as well as the problem already loaded. For large experiments with a large number of runs it's advised to be very selective of what you show in your results. Memory requirements can quickly grow when you have e.g. charts and a lot of other information in your results. Consider that you create a line chart with 5 rows over 100.000 iterations in your result. The memory requirement for the raw data is about 5*100k*sizeof(double)/1024 = 3.8Mb for the chart alone. This is not so much of a problem for the analysis of a couple of hundred runs, but with several thousand runs this information cannot be traced anymore, or at least not in every iteration. If you absolutely want to have the charts, you can raise the UpdateInterval of the Analyzer parameter.
I excluded the charts by removing all unnecessary analyzers and customized the BestAverageWorstQualityAnalyzer. The last one produces the "Qualities" chart which I didn't need. So I removed the DataTableValuesCollector from the analyzer's operator graph as well as the "Qualities" parameter from the ResultsCollector in this graph. After joining the operator graph again I had an analyzer that would just output the current best, average, and worst qualities which was perfect for me as I just wanted to know on the final result. To further prune the collected values in the runs I visited every parameter and parameter's parameter in the problem and in the algorithm and unchecked the option "Show in run" for all those that I didn't need afterwards. You can see all collected values in the run if you start and stop your algorithm after it has performed some iterations. When you're getting runs that show just what you need you're ready.
When I had the template file, I cleared all runs, the engine log and saved it. I then built a program in which I put all the configurations that I wanted. Here for example I put them in static variables.
    static readonly int repetitions = 10;
    static readonly Dictionary<string, double> instances = new Dictionary<string, double>() {
      {  "berlin52",  7542  },
      {  "ch130",     6110  },
      {  "kroA100",  21282  },
      {  "pcb442",   50778  },
      {  "tsp225",    3916  }
    };
    static readonly string[] crossovers = new string[] {
      "CyclicCrossover2",
      "EdgeRecombinationCrossover",
      "MaximalPreservativeCrossover",
      "OrderBasedCrossover",
      "OrderCrossover2",
      "PartiallyMatchedCrossover",
      "UniformLikeCrossover"
    };
    static readonly string[] mutators = new string[] {
      "InsertionManipulator",
      "InversionManipulator",
      "ScrambleManipulator",
      "Swap2Manipulator",
      "Swap3Manipulator",
      "TranslocationInversionManipulator",
      "TranslocationManipulator"
    };
    static readonly int[] elites = new int[] {
      0, 1
    };
    static readonly double[] mutationProbabilities = new double[] {
      0, 0.05, 0.1
    };
    static readonly string[] selectors = new string[] {
      "LinearRankSelector",
      "ProportionalSelector",
      "TournamentSelector"
    };
You can calculate the number of configurations by multiplying all the choices. In this example we obtain roughly 4410 configurations (a bit less because a setting of 0% mutation probability doesn't require us to test all the mutation operators). But because a Genetic Algorithm is stochastic we have to repeat testing each configuration a couple of times (e.g. 20) resulting in a total of more than 80,000 individual runs that have to be calculated. I decided that I would split this up into a couple of smaller experiments, so I created a separate experiment for every problem instance and further separated those experiments by configurations with 1-elitism and those that do not use elitism. This left me with about 400 configurations per experiment and a total of 10 experiment files which also could be executed on 10 different machines to speed up processing.
The code for creating the experiment and the configurations is given below. If you're interested to run this, I'd suggest you download the attached Visual Studio 2010 solution. It requires that HeuristicLab 3.3.5 is installed in "C:\Program Files\HeuristicLab 3.3".
    static void Main(string[] args) {
      Console.Write("Loadig template... ");
      var template = XmlParser.Deserialize<GeneticAlgorithm>("GA TSP Template.hl");
      Console.WriteLine("done.");

      MultiAnalyzer analyzer = (MultiAnalyzer)template.Analyzer.Clone();
      string instanceDir = Path.Combine(Environment.CurrentDirectory, "TSPLIB");

      foreach (var instance in instances) {
        var tsp = (TravelingSalesmanProblem)template.Problem;
        tsp.ImportFromTSPLIB(instanceDir + "\\" + instance.Key + ".tsp", instanceDir + "\\" + instance.Key + ".opt.tour", instance.Value);
        tsp.DistanceMatrixParameter.Value = null;
        tsp.Name = instance.Key;
        template.Analyzer = analyzer; // the analyzer in the template is customized and would otherwise be overwritten
        foreach (var elite in elites) {
          var experiment = new Experiment("TSPLIB (" + instance.Key + "), GA (Elites = " + elite.ToString() + ")");
          foreach (var crossover in crossovers) {
            foreach (var selector in selectors) {
              Console.Write(".");
              foreach (var mutProb in mutationProbabilities) {
                if (mutProb > 0) {
                  foreach (var mutator in mutators) {
                    var batchRun =
                      new BatchRun("GA (Elites = " + elite.ToString() + ", Crossover = " + crossover + ", Selector = " +
                                   selector + ", Mutator (" +
                                   mutProb + ") = " + mutator);
                    batchRun.Repetitions = repetitions;
                    var gaTsp = (GeneticAlgorithm)template.Clone();
                    gaTsp.Name = batchRun.Name;
                    gaTsp.Elites.Value = elite;
                    gaTsp.Crossover = gaTsp.CrossoverParameter.ValidValues.Single(x => x.Name.Equals(crossover));
                    gaTsp.Selector = gaTsp.SelectorParameter.ValidValues.Single(x => x.Name.Equals(selector));
                    gaTsp.MutationProbability.Value = mutProb;
                    gaTsp.Mutator = gaTsp.MutatorParameter.ValidValues.Single(x => x.Name.Equals(mutator));

                    batchRun.Optimizer = gaTsp;
                    experiment.Optimizers.Add(batchRun);
                  }
                } else {
                  // no mutation case, similar to above, excluded for brevity
                }
              }
            }
          }
          Console.Write(Environment.NewLine + "Saving experiment (Instance = " + instance.Key + ", Elites = " + elite + ")... ");
          XmlGenerator.Serialize(experiment, string.Format("GA TSP Experiment " + instance.Key + " " + elite + ".hl"));
          Console.WriteLine("done.");
        }
      }
    }
Each of the 10 experiment files should take about 10Mb disk space, it will take a couple of minutes to generate each of them.
Chart export dialog for publication ready images
I'm working on a new export dialog for making publication-ready images of every EnhancedChart in HeuristicLab 3.3. Right-click inside a chart and select "Export Chart...". You'll get a dialog with a preview option where you can adjust the font sizes, specify the width and height in cm or inch, resolution in dpi or dpcm and even change or add axes descriptions and/or the title. Be aware that some charts have multiple chart areas and the correct one needs to be selected at the top.
The feature is still under development, see ticket #1611 for details. It's contained in the latest trunk build.
Tips to enhance it are welcomed.

 rss
rss
