| Version 11 (modified by ascheibe, 12 years ago) (diff) |
|---|
A page for collecting and discussing statistical analysis of metaheuristic optimization experiments.
In metaheuristic optimization experiments we measure the outcome of a stochastic process. From this measurements we hope to estimate the distribution mean of the outcome. The outcome usually is a certain quality or the time/iterations required to reach a certain quality. These outcomes are random variables with unknown distributions.
The goal in those experiments is to show that one process is able to achieve a better output than another process. There are several ways to show this:
- Visual analysis methods
- Statistical hypotheses tests for unequality of two means
Statistical Background
Statistical Analysis Methods
- Single comparison
- Multiple comparison
Visual Analysis Methods
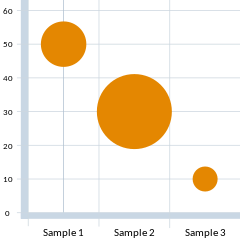
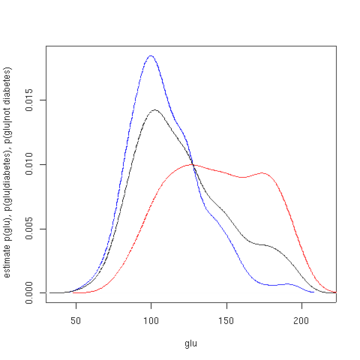
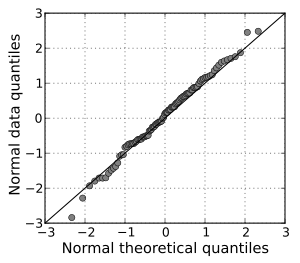
- In statistical analysis visual methods are often preferred. They can encode a lot more data and provide a clearer picture for expert human interpretation. Several possibilities exist, some have already been mentioned:
Possible Workflow / Methodology
- Testing data for e.g. normal distributions, equalness of variances, etc. to decide if parametric or non-parametric tests to apply
- In case of multiple comparisons perform ANOVA, Friedman or other tests otherwise perform single comparison t-test, Mann-Whitney, etc.
- In case multiple comparisons are significant use pairwise comparisons with post hoc analysis adjustments
One problem with such a workflow is that the error propagates in every step. So if testing for normal distributions has a certain error and ANOVA has a certain error, the final error would be a combination of the two. We should also identify and exclude cases where the application of tests would probably not be valid.
Critique
- Steven Goodman. 2008. A Dirty Dozen: Twelve P-Value Misconceptions. Seminars in Hematology Volume 45, Issue 3, July 2008, Pages 135–140
- Jacob Cohen. 1994. The Earth is Round (p < 0.05). American Psycologist. http://ist-socrates.berkeley.edu/~maccoun/PP279_Cohen1.pdf
- Hubbard, Bayarri. 2003. P-Values are not Error Probabilities. http://ftp.isds.duke.edu/WorkingPapers/03-26.pdf
References
- García, Fernández, Luengo, Herrera. 2010. Advanced nonparametric tests for multiple comparisons in the design of experiments in computational intelligence and data mining: Experimental analysis of power. Information Sciences 180, pp. 2044–2064. (http://sci2s.ugr.es/sicidm/pdf/2010-Garcia-INS.pdf)
- Salvador García, Daniel Molina, Manuel Lozano, Francisco Herrera. 2009. A study on the use of non-parametric tests for analyzing the evolutionary algorithms’ behaviour: a case study on the CEC’2005 Special Session on Real Parameter Optimization. (http://sci2s.ugr.es/publications/ficheros/2009-garcia-JH.pdf)
External Libraries
- meta numerics implements some statistical tests (e.g. ANOVA, Mann-Whitney U, ...) but is licensed under the MS PL which is incompatible with the GPL.
- Accord.NET / AForge.NET: From the Accord.NET website: "Accord.NET is a framework for scientific computing in .NET. The framework builds upon AForge.NET, an also popular framework for image processing, supplying new tools and libraries. Those libraries encompass a wide range of scientific computing applications, such as statistical data processing, machine learning, pattern recognition, including but not limited to, computer vision and computer audition. The framework offers a large number of probability distributions, hypothesis tests, kernel functions and support for most popular performance measurements techniques." These libraries actually provide a lot of stuff which we don't need. Gladly the math/statistics parts can be extracted very easily (they are own assemblies). Accord.NET implements OneWayAnova, TwoWayAnova(1,2,3), T-test, Mann-Whitney Wilcoxon, Kolmogorov-Smirnov and a lot more. And they are both licensed under LGPL so we don't have a problem with licensing.
Links
- STATService for comparison of metaheuristic results
- Post-hoc analysis
- Friedman test example
- Criticism of friedman test
- Statistical Tests Overview
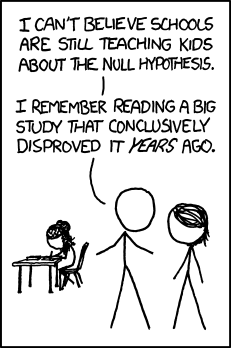
Significant
Attachments (1)
- significant.png (289.1 KB) - added by gkronber 12 years ago.
Download all attachments as: .zip


