


| Version 10 (modified by gkronber, 10 years ago) (diff) |
|---|
Knowledge Discovery through Symbolic Regression with HeuristicLab
Demonstration at the European Conference on Machine Learning and Principles and Practice of Knowledge Discovery in Databases (ECML PKDD), September 24th to 28th, 2012, Bristol, UK.
- Introduction
- Case Study: Tower Data
- Identification of Non-Linear Models
- Identification of Relevant Variables
- Simplification of Models with Visual Hints
Introduction
HeuristicLab is an open-source environment for heuristic optimization. The software includes several optimization algorithms and problems and is targeted to three relevant user groups: practitioners, experts, and students. Practitioners are trying to solve real-world problems with classical and advanced algorithms. Experts include researchers and graduate students who are developing new advanced algorithms. Students can learn about standard algorithms and can try different algorithms and parameter settings to various benchmark algorithms. The design and architecture of HeuristicLab is specifically tuned to these three user groups and we put a strong emphasis on the ease of use of the software. The latest version can be obtained from http://dev.heuristiclab.com/download free of charge under the restrictions of the GNU General Public Licence (GPL).
The following video is a brief tour of the features of HeuristicLab. Several more videos are available on our youtube channel
In this demonstration we concentrate on the unique features of HeuristicLab for data mining and knowledge discovery. The software provides a number of well-known standard algorithms for classification and regression tasks (linear regression, random forest, SVM, ...) and additionally includes an extensive implementation of symbolic regression based on genetic programming. Symbolic regression discovers the necessary structure and parameters of a regression model automatically through an evolutionary process by assembling basic building blocks: random constants, input variables, arithmetic operators, and the logarithm and exponential functions. So, symbolic regression is especially useful in applications where there is only little prior knowledge about the modeled system or process and it is necessary to infer the necessary model structure and conditional dependencies directly from the available data. The result of symbolic regression is a functional expression describing the modeled target variable based on the values of relevant input variables. Symbolic regression produces white-box models as shown below that can be analysed and improved by domain experts and can thus facilitate knowledge discovery.
Case Study: Tower Data
The demonstration will show how HeuristicLab can be used for knowledge discovery in a real world application, in particular, for finding relevant driving factors in a chemical process and for the identification of white-box regression models for the process. We use the tower data set which is kindly provided by Dr. Arthur Kordon from Dow Chemical (also see http://www.symbolicregression.com/?q=towerProblem). First we use symbolic regression to create a white-box regression model for the chemical process. Afterwards we describe how the algorithm can be used to determine the most important driving factors for the process. In the end we show how symbolic regression models can be manually simplified and how visual hints can guide the user in the simplification process.
Identification of Non-Linear Models
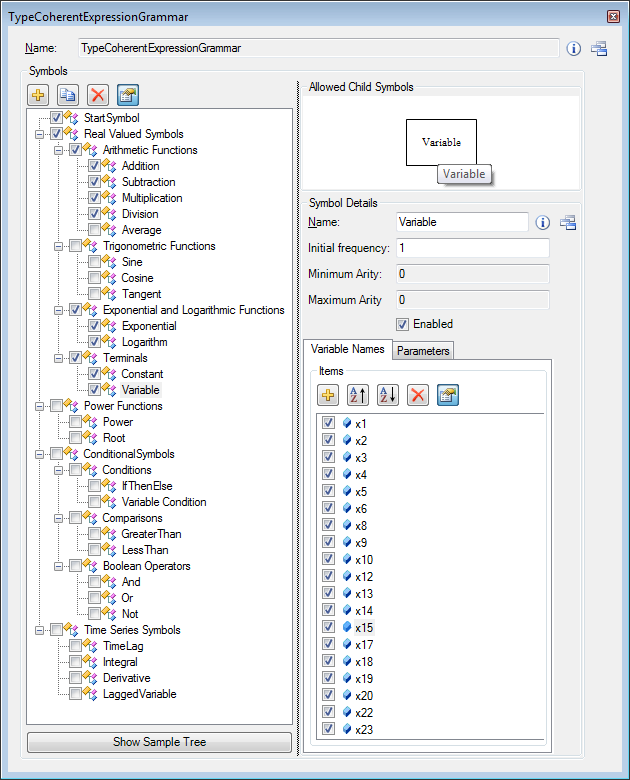
As a preparation for symbolic regression a number of parameters have to be configured. A very important parameter is the grammar that restricts the possible shapes of evolved models and defines the basic building blocks for symbolic regression models (function set).

Other important parameters are the error function that should be minimized (e.g. mean of squared errors, mean of absolute errors, Pearson's R², ...), and the maximal size of the models. Additionally the parameters of the underlying evolutionary algorithm like population size, mutation rate, and number of iterations can be configured.
The following equation shows a non-linear model for the tower data set as identified by symbolic regression in HeuristicLab.

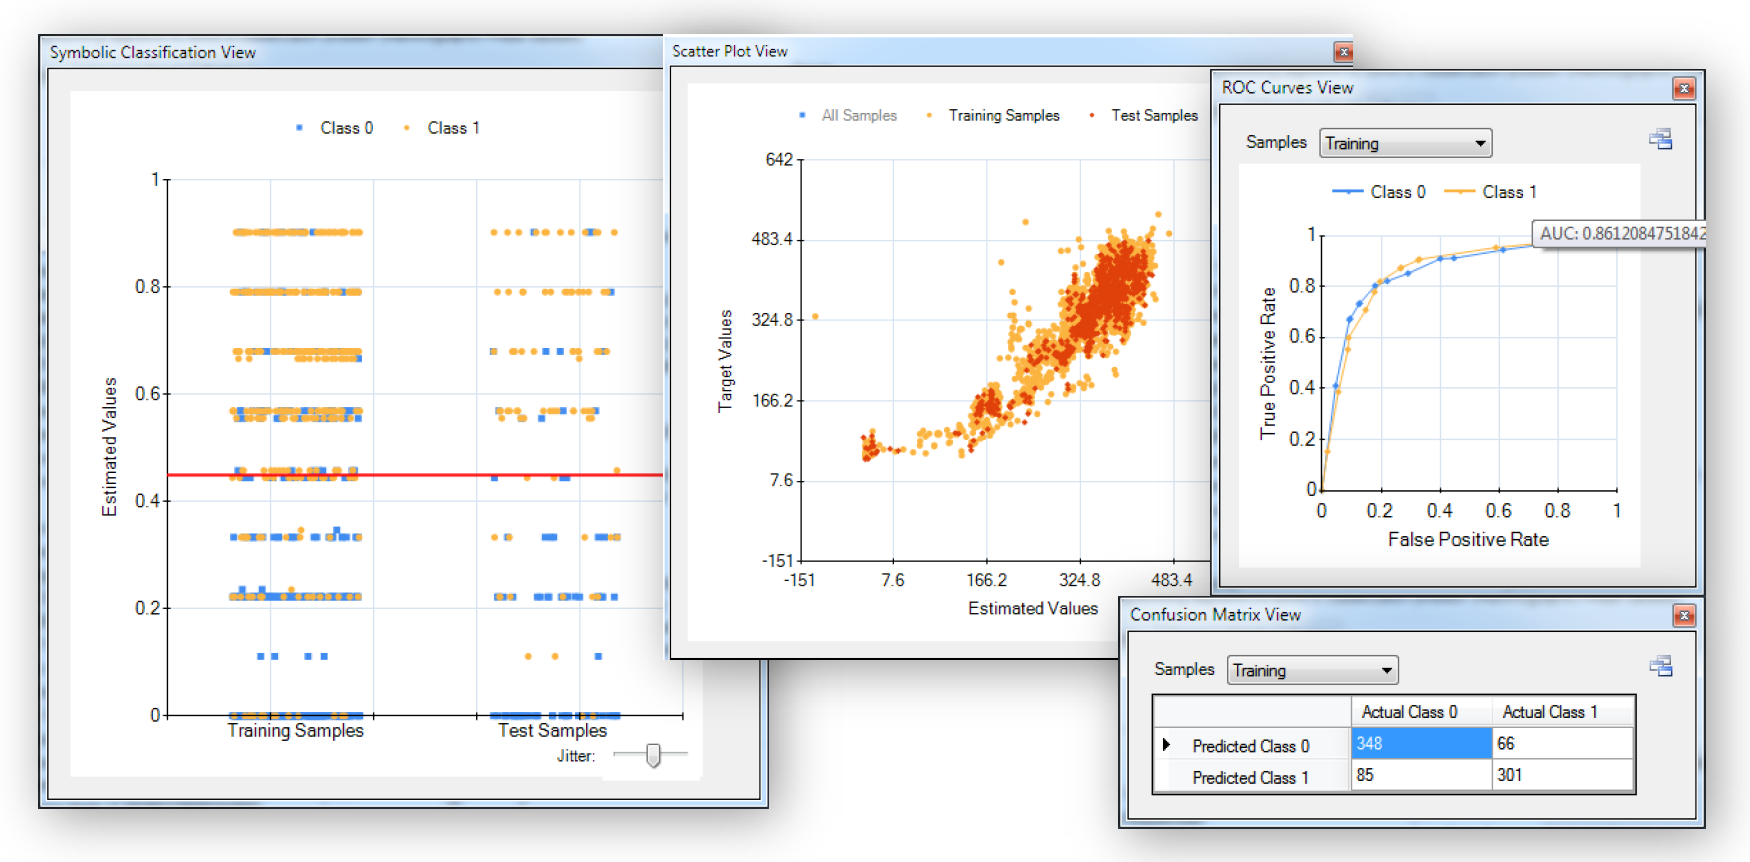
In HeuristicLab a number of different charts and error metrics are available directly in the GUI for each produced solutions. All results are updated dynamically while the algorithm is running.

Identification of Relevant Variables
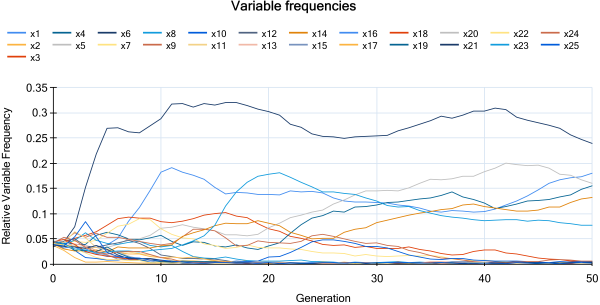
Frequently it is not necessary to learn a full model of the functional relationship but instead only find a set of relevant variables for the process. This can be achieved easily with HeuristicLab through analysis of relative variable frequencies in the population of models. The following Figure shows a variable frequency chart that clearly shows the six most relevant variables. Notably, the relevance of variables is determined based on non-linear models. So, non-linear influence factors and pair-wise interacting factors can be identified as well.

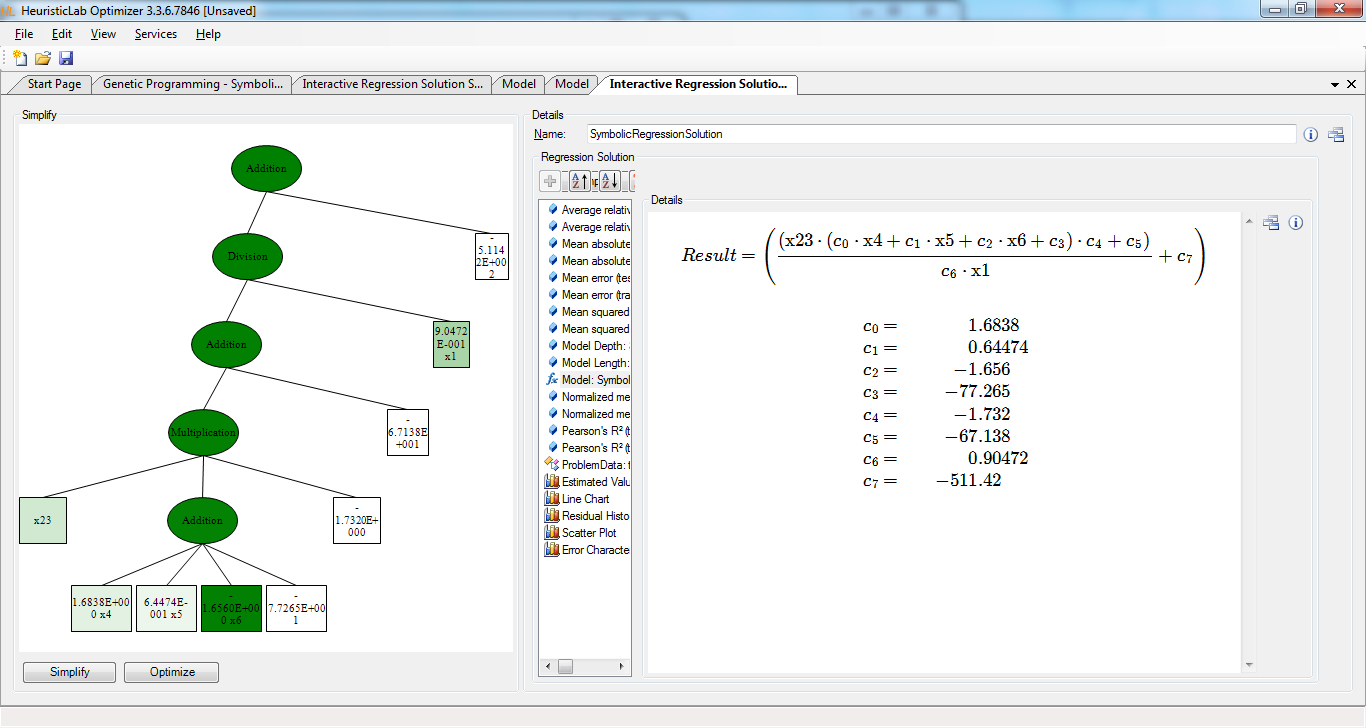
Simplification of Models with Visual Hints
A unique feature of HeuristicLab are visual hints for model simplification. By means of visual hints it is very easy to manually prune a complex model as shown above to find a good balance between complexity and accuracy. The following Figure shows the GUI for model simplification. Green model fragments have a strong impact on the model output while white fragments can be pruned with minimal losses in accuracy, in contrast red fragments increase the error of the model and should be removed. The GUI for model simplification immediately recalculates all error metrics and updates charts dynamically whenever a part of the model is changed by the user.

The final model achieved after simplification.

Attachments (6)
- simplification.png (203.1 KB) - added by gkronber 12 years ago.
- screenshots.png (369.2 KB) - added by gkronber 12 years ago.
- relevantvariables_small.png (54.4 KB) - added by gkronber 12 years ago.
- simplifiedmodel.png (103.8 KB) - added by gkronber 12 years ago.
- model_math.png (30.2 KB) - added by gkronber 12 years ago.
- grammar.png (49.3 KB) - added by gkronber 12 years ago.
Download all attachments as: .zip